Frontier in Biomedical Signal Processing
Publication: Prediction of Treatment Response in Triple Negative Breast Cancer From Whole Slide Images
I published my final PhD work entitled Prediction of Treatment Response in Triple Negative Breast Cancer From Whole Slide Images in Frontier in Biomedical Signal Processing. The preprint is available on bioarxiv, another version of the paper is available here.
Data
The data used for the study is not available and is constituted of 336 biopsy samples scanned at the Institut Curie. The paper is a natural extension of our IBSI 2019 publication and biopsy sections undergoes the same treatment. As the data has been notable increased we give the new partition of labels: pCR (167), RCB-I (27), RCB-II (113) and RCB-III (29), and similarly we aim at predicting two task: (1) Prognostic pCR-RCB-I vs RCB-II-III and (2) Residual pCR vs RCB-I-II-III.
Code availability
The code to run the experiments can be found in the following github repository: github.
Summary of the paper
We note 4 contributions:
1) Benchmark of several state of the art architectures with respect to their performance 2) Novel model for WSI predictions, CONAN. 3) A suitable model selection procedure that can cope of small datasets and avoids re-training. 4) We apply all this to the prediction of treatment response in TNBC patients.
This work tries fits in the field of fat data where we have relatively few samples (336) and each is high-dimensional (60Gb uncompressed on average). Deep neural networks (DNN) are not well adapted to this situation as they are over-parametrized and will over-fit on such a small dataset even with strong regularisation. They are still the model of choice due to their end to end training and flexibility as we can connect the high-dimensional input directly to the label with a multiple instance learning framework.
Limitations and new framework
Difficult task
Prediction of treatment response is one of the most difficult tasks in digital pathology. Unlike tasks like tumour detection and subtyping, where many papers show evidence of high accuracies, there are no known visual cues that would allow for the prediction of treatment response. This task is currently unresolved for human physicians. Moreover, datasets with treatment response are usually much smaller than datasets acquired in clinical routine for tasks such as automatic grading, metastasis detection or subtype prediction. 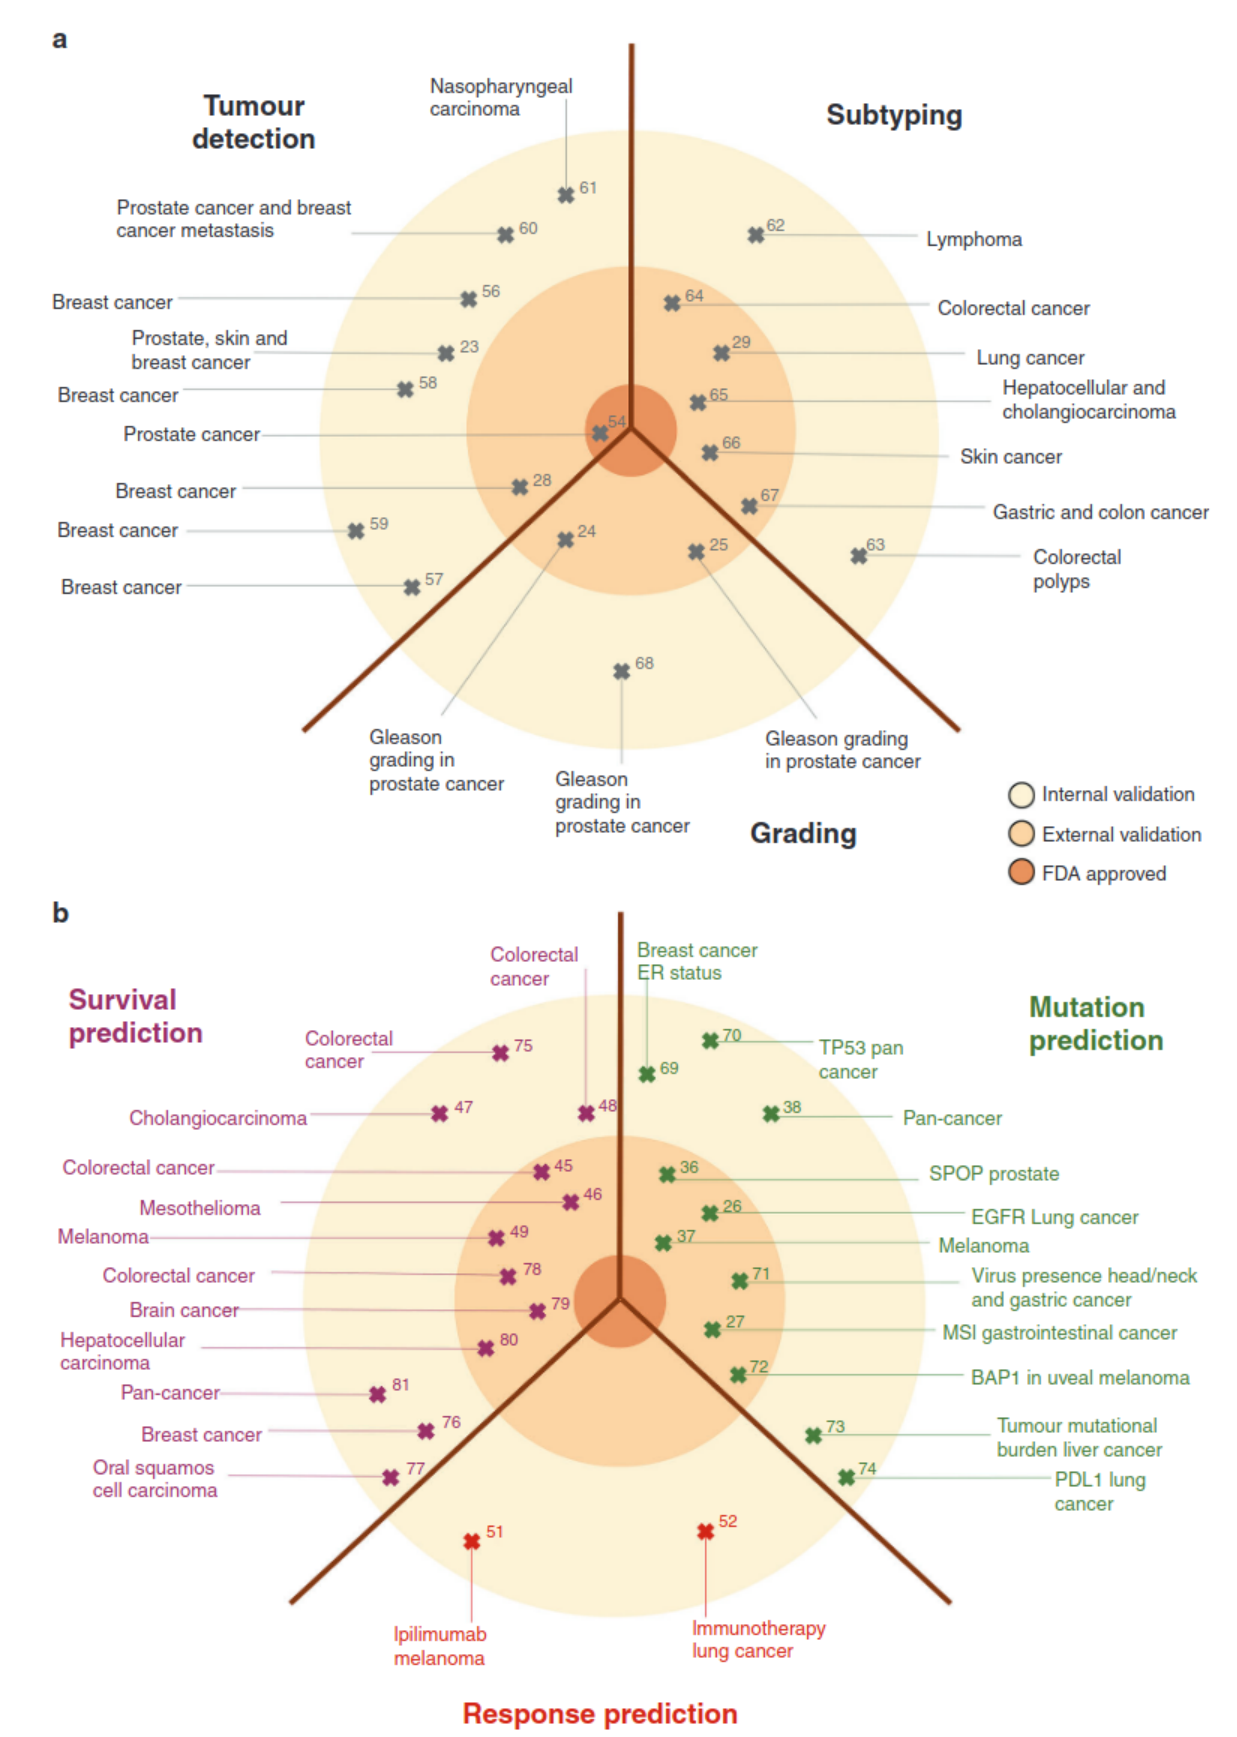 Figure 1: Clinical applications of basic and advanced deep-learning image analysis in histopathology (Echle et al., 2021)
To the best of our knowledge, only one other paper discuss’ the prediction of treatment response (other than my own publications) and report scores between 0.65 and 0.75 of AUC on a cohort which is twice the size of our own. To this end they combined the datasets from two hospitals and used federated learning methods.
Current validation for DNN
DNN for fat data is not the best suited in this situation as it is well known that DNN needs sufficient data in order to converge to the proper solution. However there flexibility and attention mechanism are worth our investigation and study. We first find that even with the same hyper parameter, inherent randomness in the optimisation of DNN leads to different solution shown by a large variance in scores. Secondly that early stopping is an efficient tool to prevent this randomness by stabilizing the convergence of the training. We believe that this is due to the parameter search space being relatively flat when the number of samples are low, thus early stopping is powerful mean of regularisation and of reproducibility. In Figure 2.A we show the inherent randomness found in DNN.
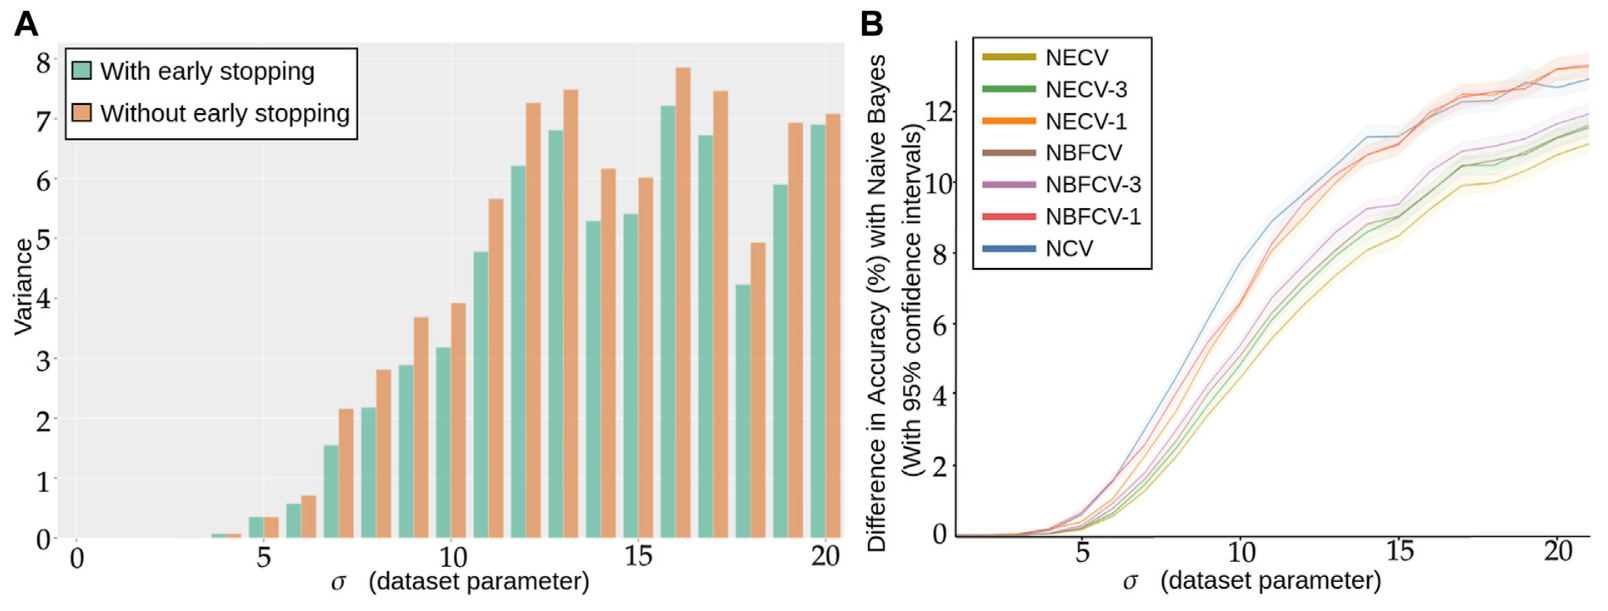 Figure 2: (A) Repeated training, with and without early stopping: (A) Performance Variance, as measured on an independently simulated test set, (B) Comparison of models trained with NCV, NECV and NBFCV. On the y-axis we have the difference in accuracy between the Naive Bayes model and a given validation approach. As the data distribution is known, the Naive Bayes is a theoretical upper limit of the achievable performance. Curves are shown with 95% confidence intervals. A lower curve implies a better score.
This problem becomes more apparent when we wish to actually optimize the parameters in the DNN, a common tool is Nested Cross Validation (NCV). Currently, NCV can’t use early stopping as the final model is retrained on the full dataset. The procedure is givin below:
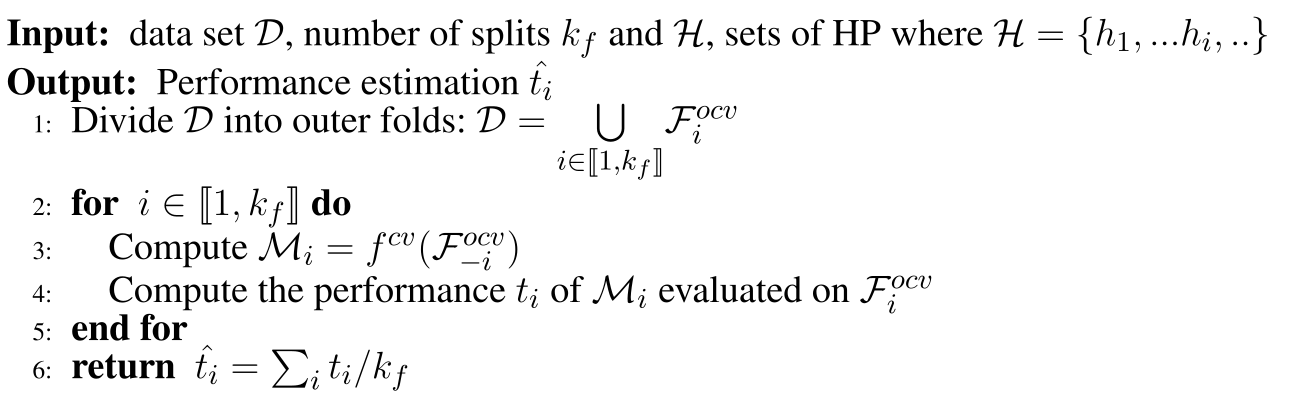 Algorithm 1: Nested Cross Validation. $f^{cv}$ returns a model where we the best set of parameters are given with an inner cross validation and the returned model is trained with them on the whole given dataset. $\mathcal{F}^{ocv} denotes an outer fold with or without section $i$$.
The current procedure suffers from the for-mentioned issue, $f^{cv}$ re-trains the model once it has found the best set of hyper-parameters. We modify this procedure in order to return the ensemble of the models where the set of hyper-parameter maximises the inner-fold validation procedure and to make use of early stopping, we name this model Nested Ensemble Cross Validation (NECV). We compare this procedure to NBFCV, where we ensemble the models that maximise the inner-folds. In particular we denote by NECV-x the model that retains only the $x$ model that achieves the $x$-highest scores on the validation.
For example: in NECV, with 5 folds. We train for every set of hyper parameters on each fold, we pick the hyper parameter set that maximise the average hyper parameter set. We therefore have 5 models trained with these hyper parameters, NECV-1 means picking the model out of these 5 that maximises the score. To note, this comparison can be seen as unfair as the validation is different among these models.
Model and dataset
We use a toy dataset where we sample our samples with a standard deviation ($x$-axis in Figure 2) from two origin points. We use a simple NN which is actually the last module of the network we use for TNBC treatment prediction, see Figure 3.
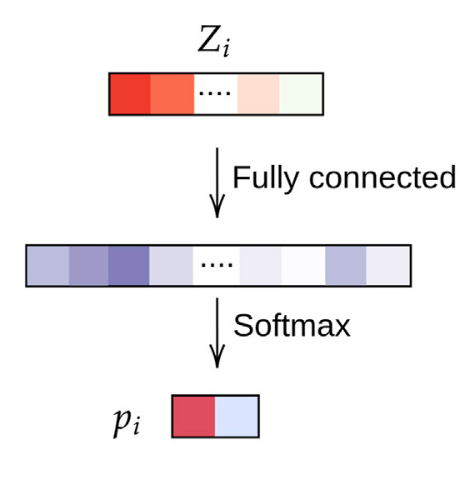
Figure 3: Simple two layer DNN for the simulation data.
Results
In Figure 2.A we show the gain of such a procedure. Our procedure outperforms on a simple simulation dataset NCV and NBFCV.
Model for WSI prediction
Patient encoding
For each sample, we segment the tissue, we divide the available tissue into tiles and we encode the tiles with a ResNet:
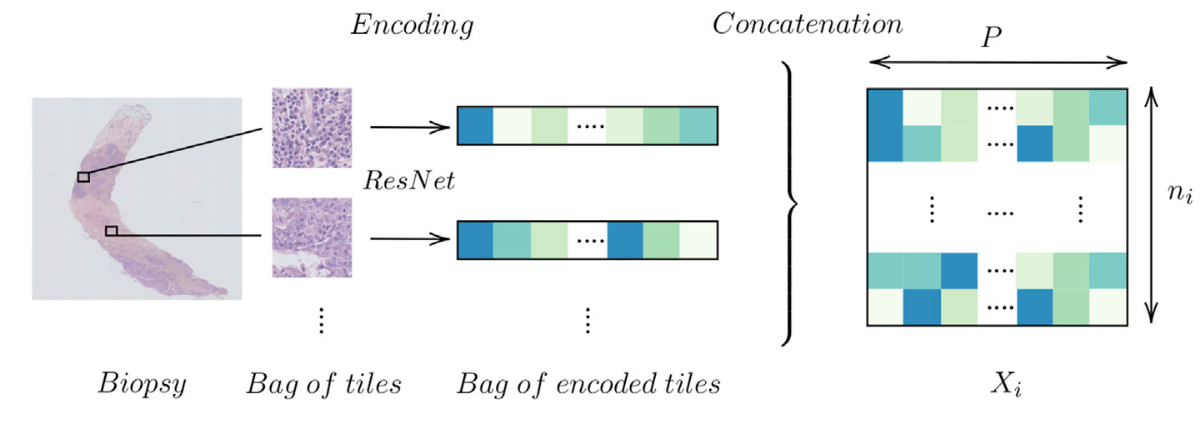 Figure 4: Encoding a biopsy
Model architecture
We propose a novel framework composed of 3 blocks for WSI prediction: tile-level, pooling and biopsy-level. The first block is mostly comprised of 1D convolutional layers where we aim to find a practical and meaningful embedding of our tiles. We pool the information and finally derive from this latter representation (a WSI encoding) a classification probability. The template is given in given in Figure 5.
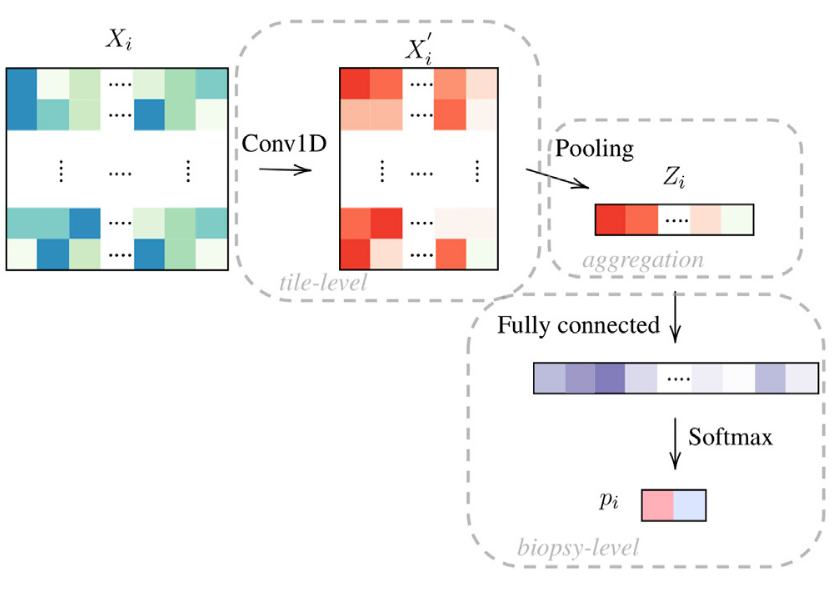 Figure 5: Framework with 3 blocks, tile-level, pooling and biopsy-level. We denote this network as OneOne (for one layer in the tile-level and in the biopsy-level block.
Pooling layers
We experiment with three types of pooling: average pooling Fig 6.A, attention layer (WELDON pooling) Fig 6.B and our own pooling layer, WELDON concatenate Fig 6.C. The expected gain of concatenating the tile level representation to the latter parts of the network is to help the final classification to use the tile selected features. This can also be seen as an identifiability issue where we allow the network to give good/bad score to a variety of tiles but still be able to differentiate them.
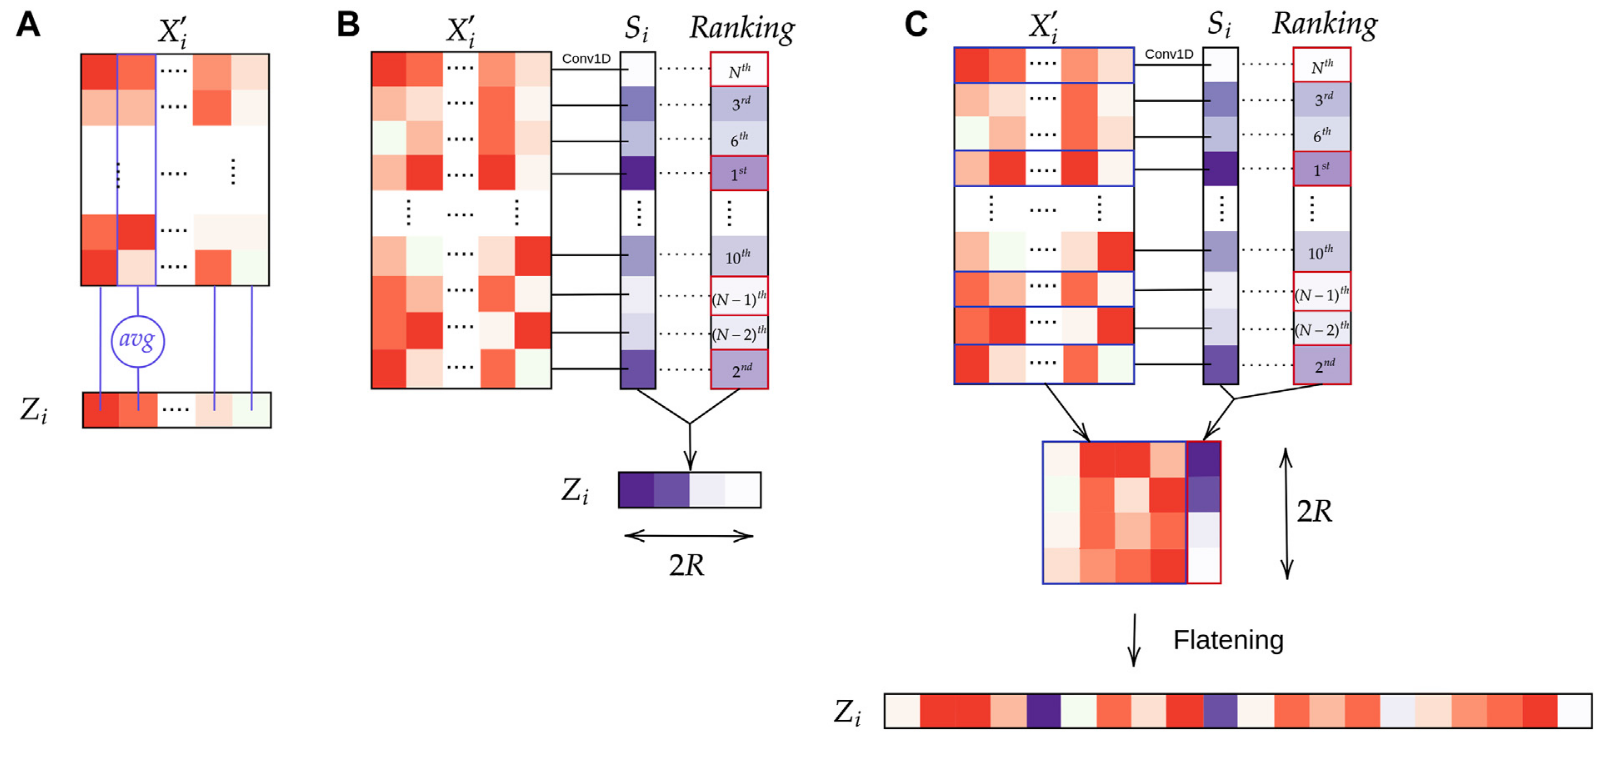 Figure 6: Aggregation layers: (A) Average pooling; (B) WELDON pooling; (C) WELDON-C pooling which is WELDON concatenated with previous tile encoding.
Final architectures
We name the model CONAN the model that uses both aggregation pooling and Weldon-c. In addition:
we can add abstraction to the tile-level block Fig 7:
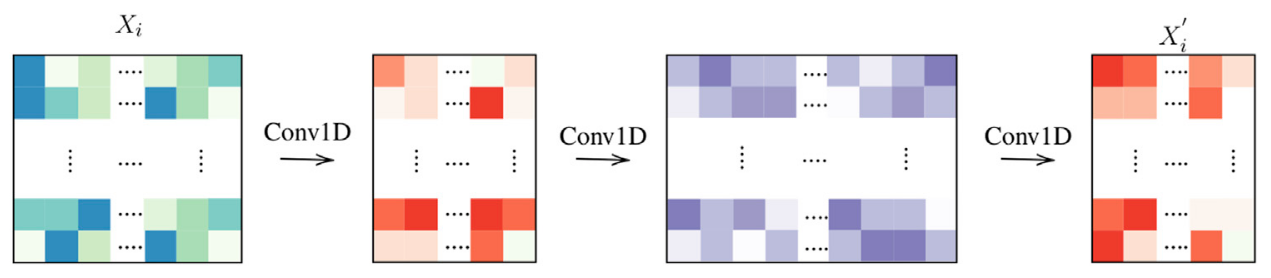 Figure 7: Tile-level encoding: 3 layers.
we can also pass the latent information with residual skip connection to help training and learning:
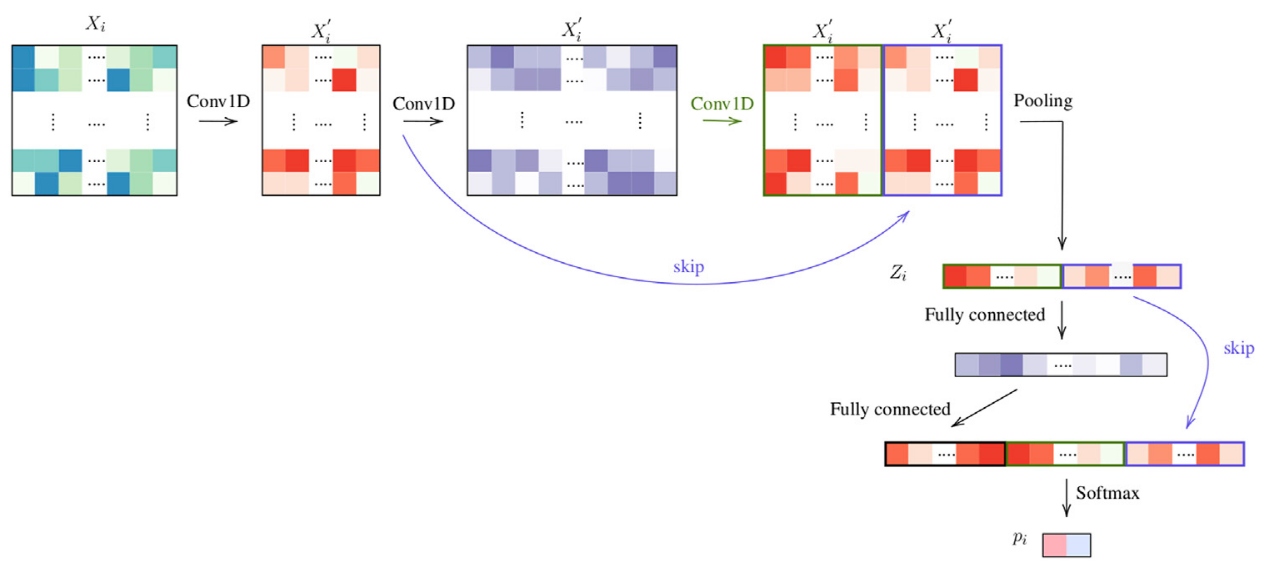 Figure 8: Architecture ThreeTwoSkip
TNBC treatment prediction
Compared models
We recapitulate all test models in Table 1:
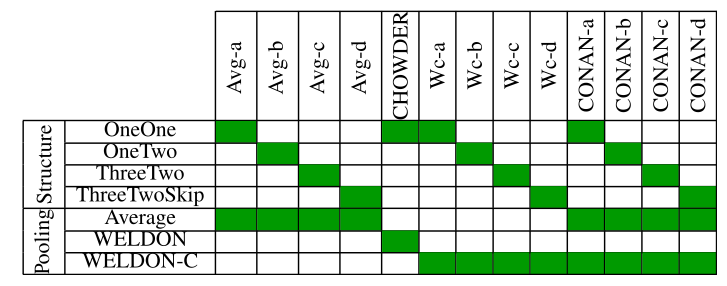
Table 1: Model architecture and pooling strategy, as described. CHOWDER has been published previously (Courtiol et al., 2018).
Results
We use our proposed validation procedure with 5 folds and display the results in the following plots, Fig 9: 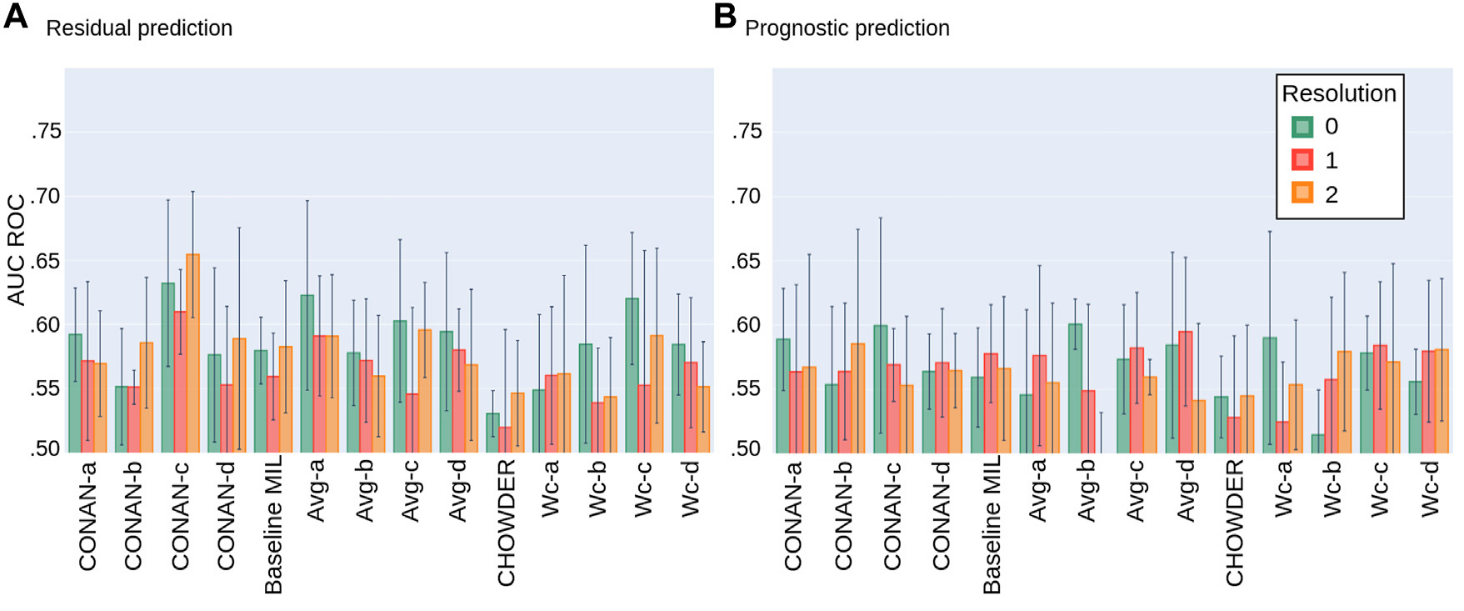 Figure 9: Average AUC ROC performance with standard deviation on five fold NECV on the task of predicting: (A) Residual cancer and (B) patient prognostic in TNBC.
Conclusion
The best model is seems to be the CONAN-c at this time as it uses the both aggregation layers to capture tile specific information as well biopsy level information.
