ISBI 2019
Publication in ISBI 2019 Predicting Residual Cancer Burden in a triple negative breast cancer cohort.
At the ISBI 2019 held in Venice, Italy, I presented our conference paper Predicting Residual Cancer Burden in a triple negative breast cancer cohort during the poster session. The poster can be found here.
Paper
The conference paper Predicting Residual Cancer Burden in a triple negative breast cancer cohort by Peter Naylor, Joseph Boyd, Marick Laé, Fabien Reyal and Thomas Walter has been published in Biomedical Imaging (ISBI 2019), 2019 IEEE 16th International Symposium on (pp. 933-937).
Data not available
The data used for the study is not available and constituted of 122 biopsy samples scanned at the Institut Curie. Each patient within this cohort followed this procedure:
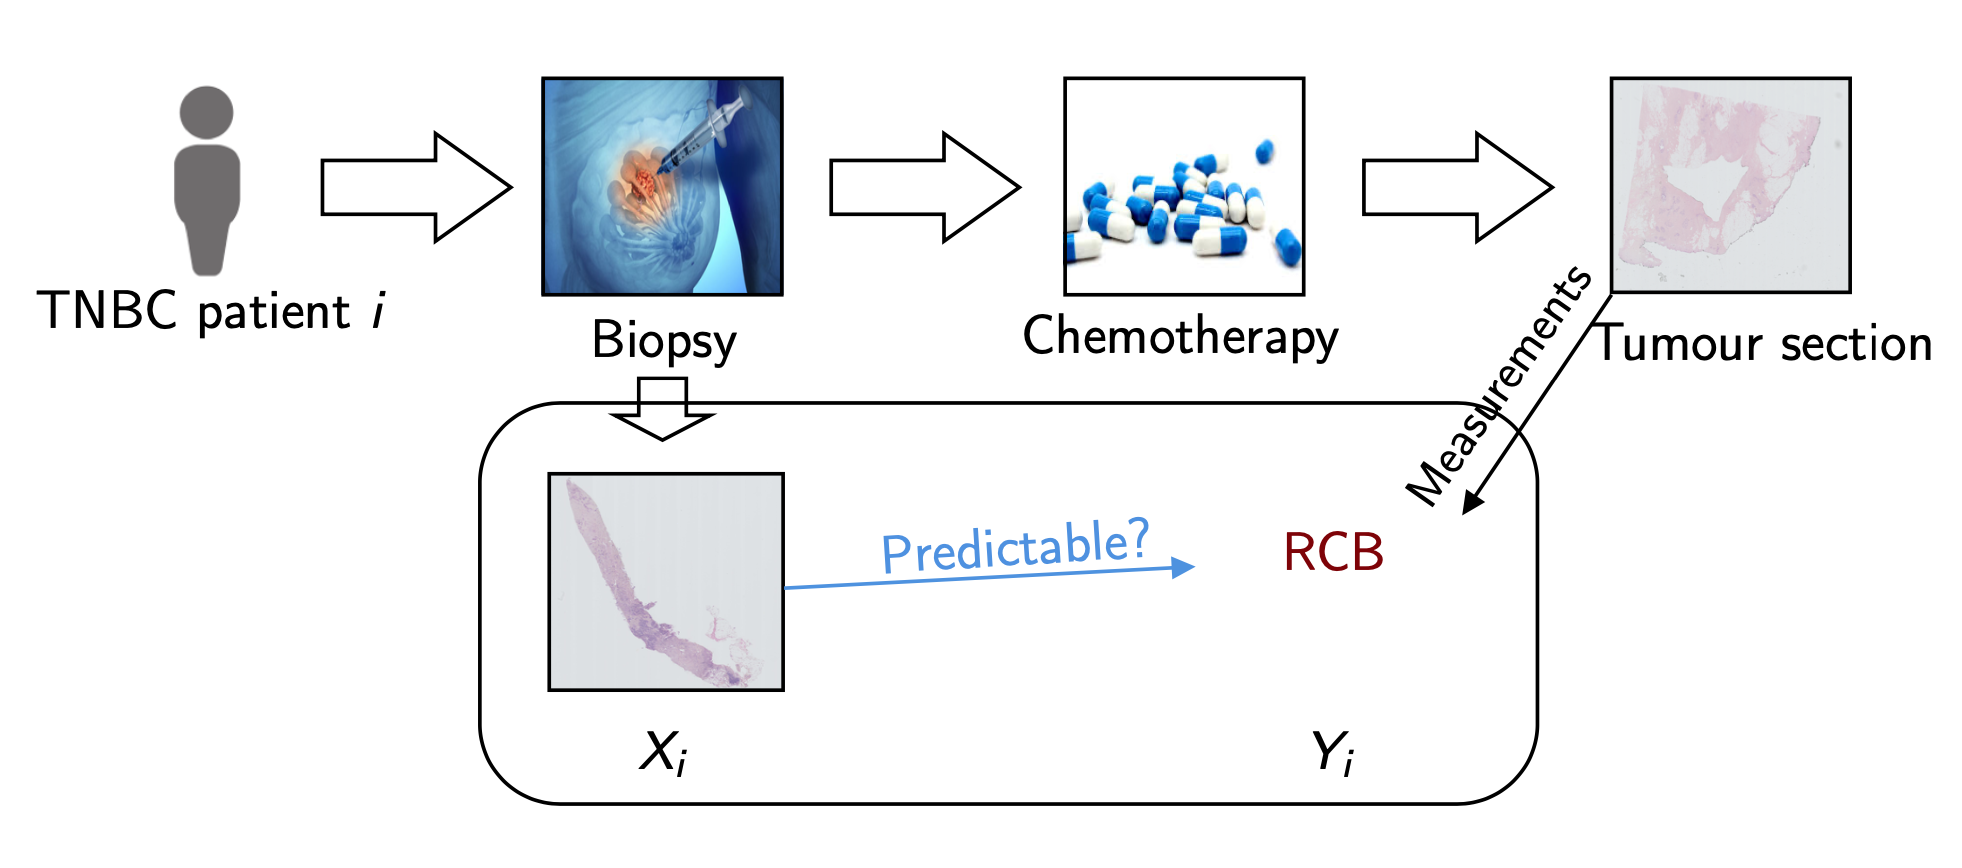 Figure 1: Data generation pipeline at Institut Curie
Before treatment, we perform needle-core biopsy samples from triple negative breast cancer patients.
After treatment, we perform a surgery to have a better idea of the residual cancer within the patient (in the primary site and axillary lymph nodes) and report a RCB score which is the variable we wish to predict. This continuous variable can be categorised into four types corresponding to four degrees of severity: pCR (56), RCB-I (10), RCB-II (49) and RCB-III (7), we aim at predicting two task: (1) Prognostic pCR-RCB-I vs RCB-II-III and (2) Residual pCR vs RCB-I-II-III.
Summary of the paper
We note 3 contributions:
1) Existence of signal for the prediction of treatment response to chemotherapy in triple negative breast cancer, 60% accuracy on these tasks. 2) Novel model for WSI predictions: two steps and one step model. 3) Better tile invariance encoding
Patient encoding
For each sample, we segment the tissue, we divide the available tissue into tiles and we encode the tiles with a ResNet:
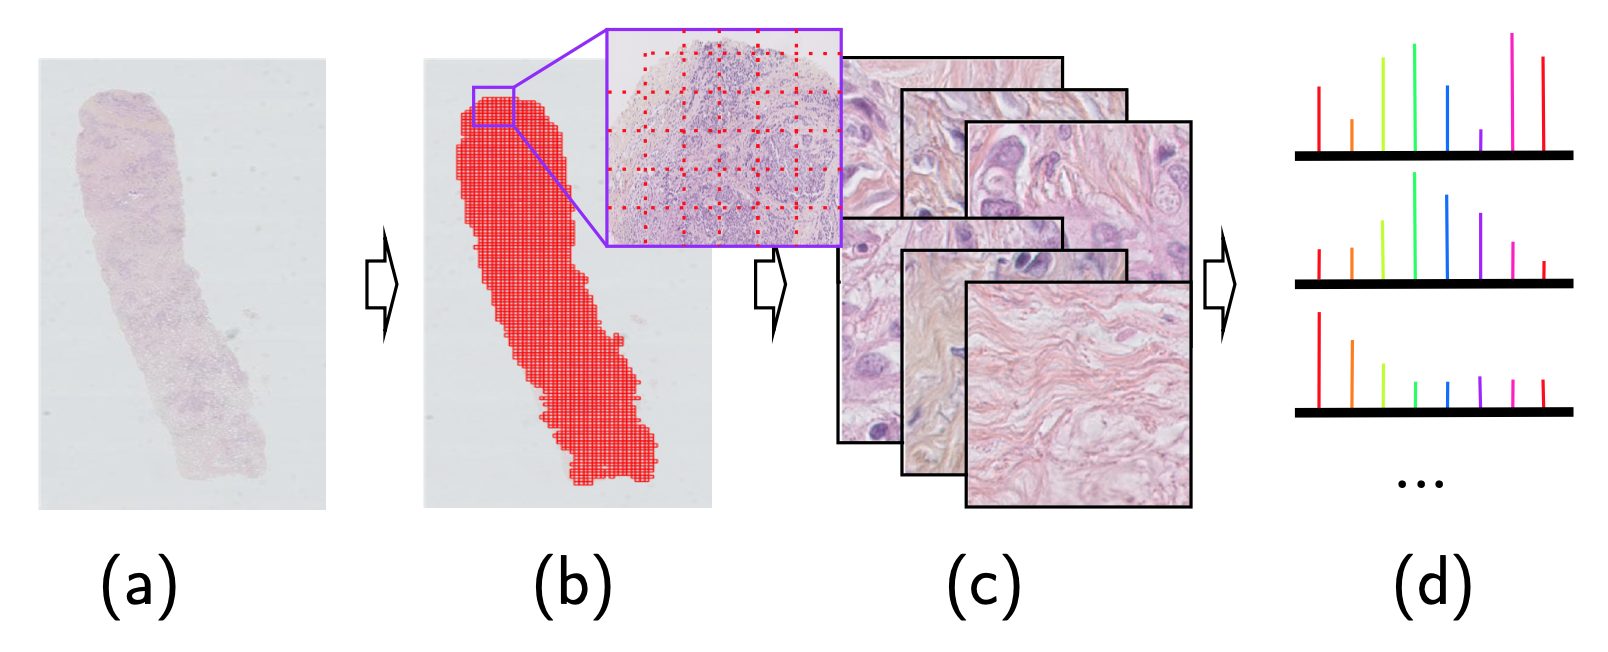 Figure 3: From the slide to a bag of encoded tiles
- Needle-core biopsy section
- Tiling the available tissue
- Bag of tiles
- Bag of encoded tiles
While encoding our histopathological tiles, we notice some undesired source of noise, specifically encoding variances to image transformation such as flip. These types of transformation should not affect the underlying encoding for histology data as there is no natural orientation given to the tile. 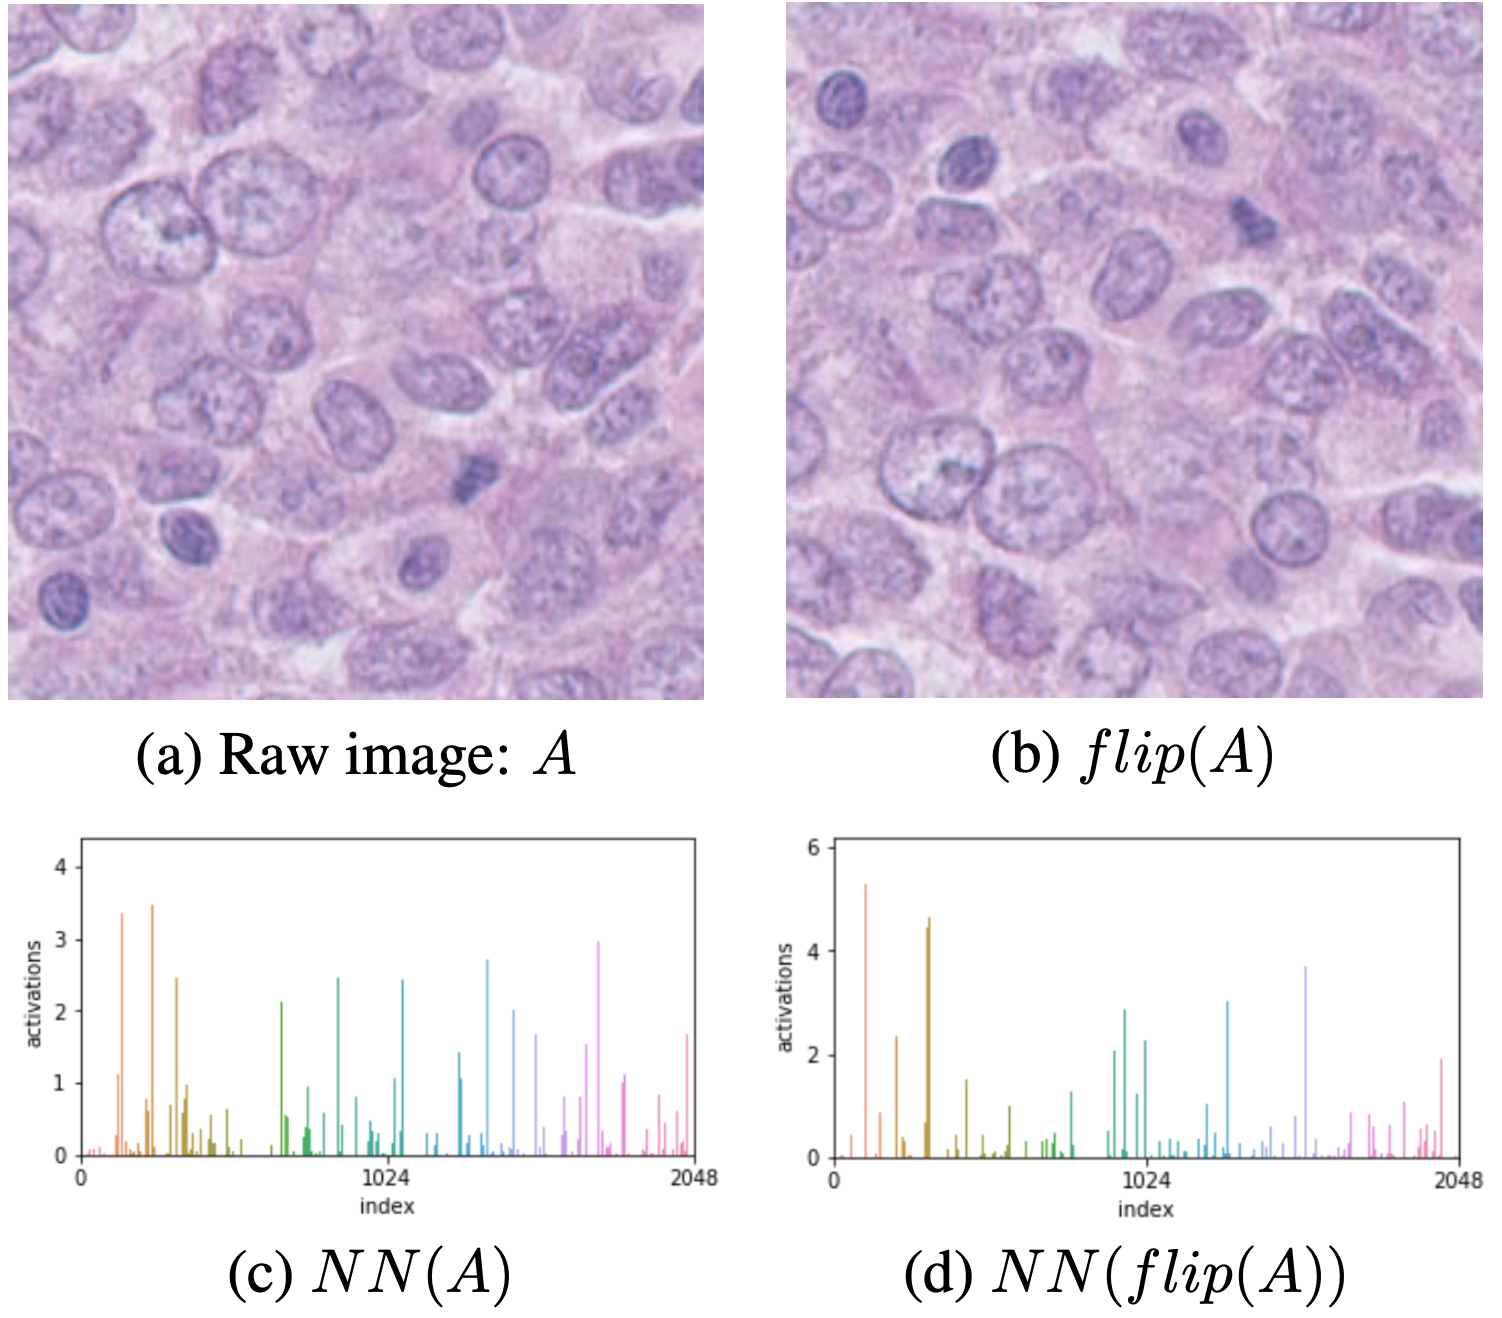 Figure 4: Encoding variances for histological images
- Input image
- Flipped input image by the *Flip* augmentation
- Encoding of the input image by the ResNet encoder *NN*
- Encoding of the flipped input image
We notice different scales in the encoding but also in different areas. This is due to the pre-training on ImageNet where the samples have a natural orientation. We propose three different encodings:
- None, solely NN(.)
- Max, for one image, we generated its encoding for several basic transformations (identity, flip, rotation, …), for this image’s final encoding, we take the max for each index over the encoded transformation.
- Mean, same idea as Max expect we take the mean per index.
Results
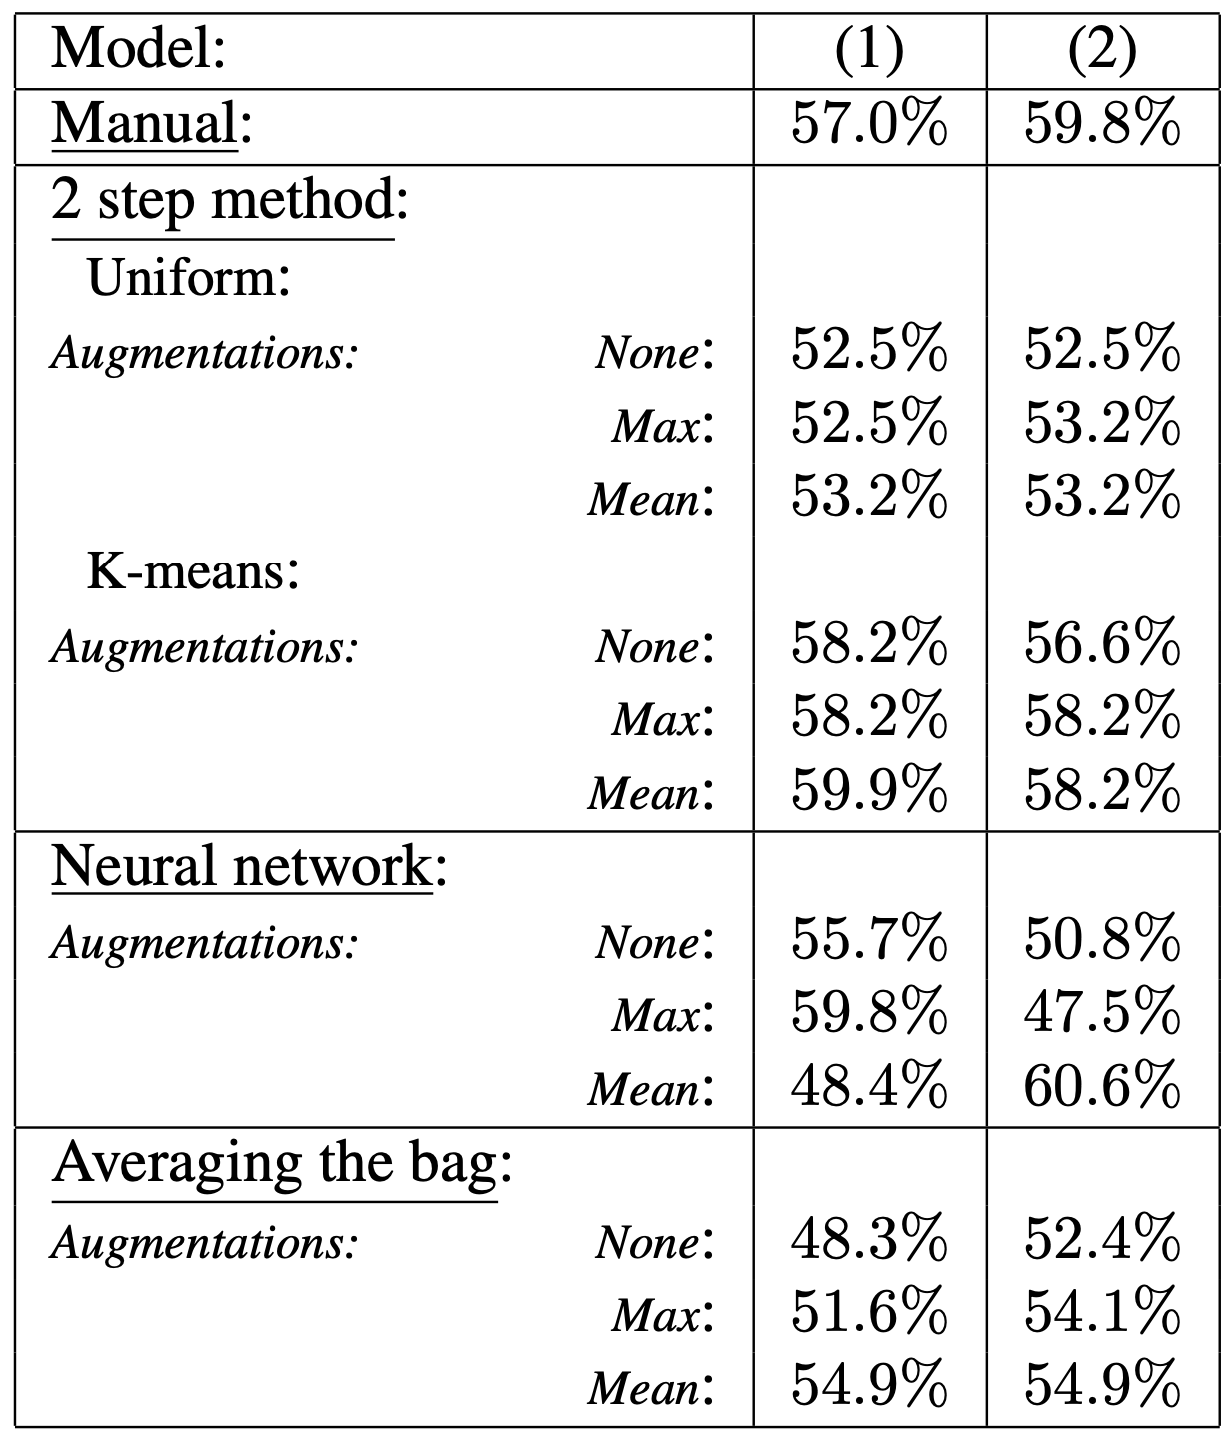 Table 1: Table of results on task (1) and (2), measure by accuracy with a 10-nested cross validation.
In the 2 step method, Uniform and K-means denote the down-sampling procedure used for the tile cluster model training.
Models
We compare 4 types of models:
Manual feature extraction
Model based on pathological relevant features extracted manually from each tissue. On top of these 5 extracted variables we put a random forest on top.
Example of manual extracted features:
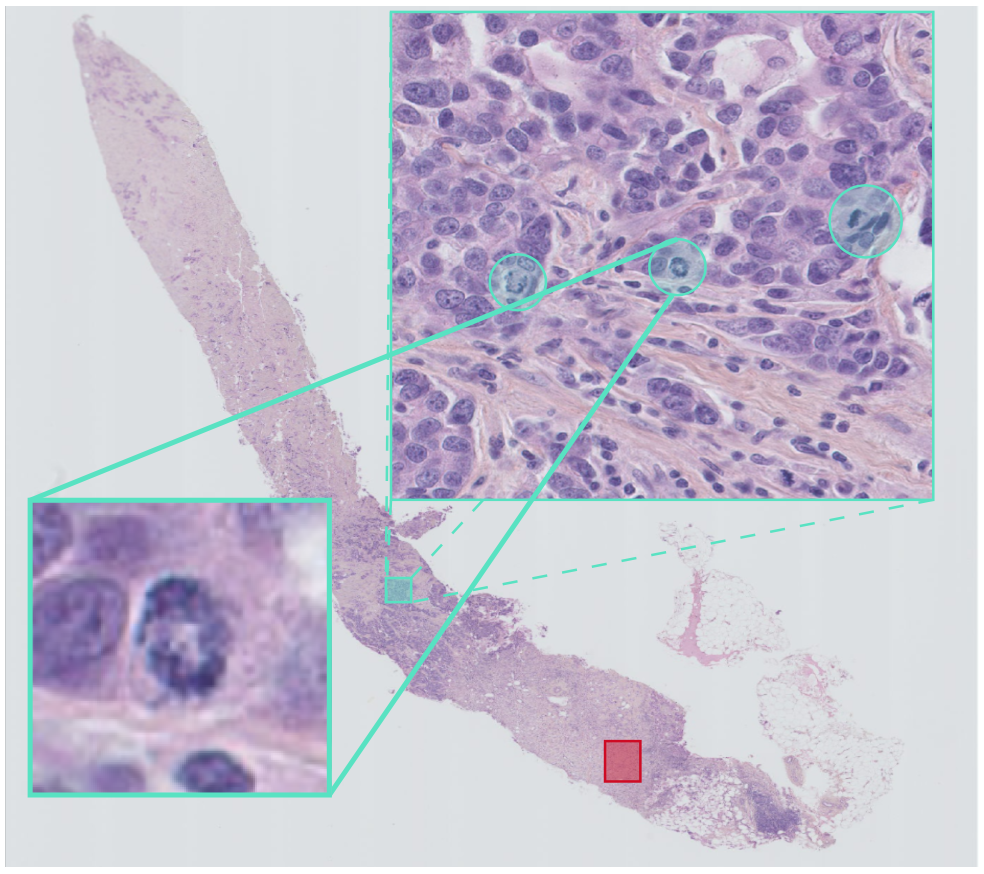 Figure 5: Mitotic index
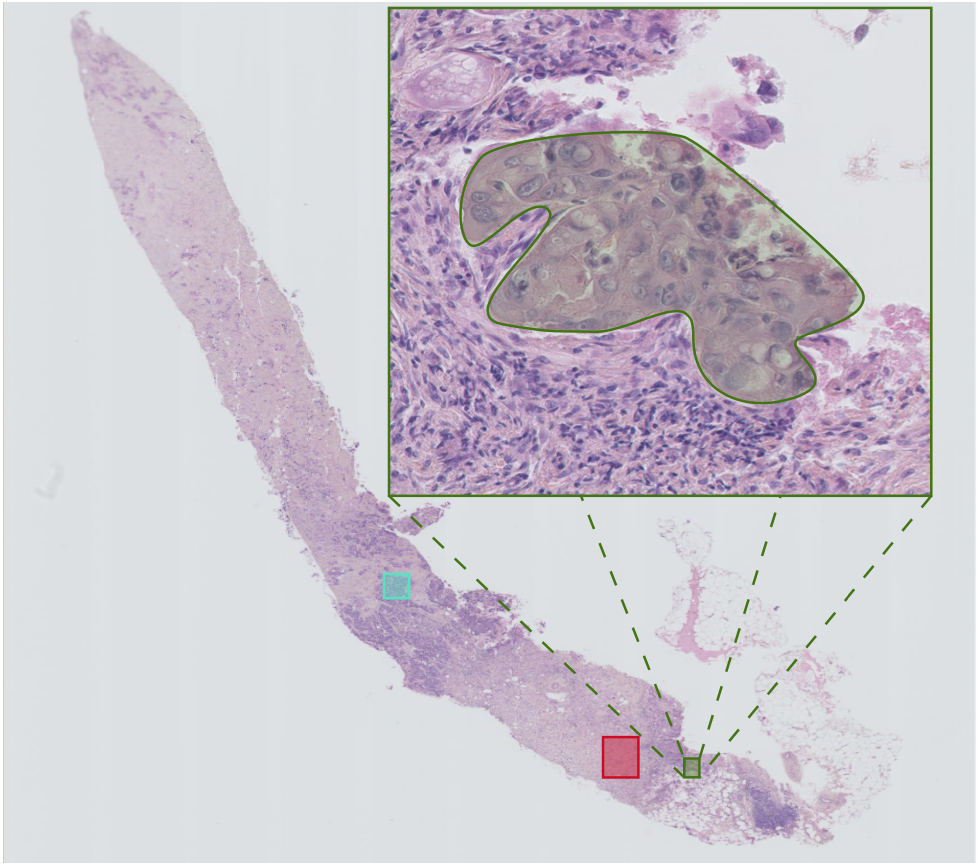 Figure 6: Cancer cellularity
Two step model
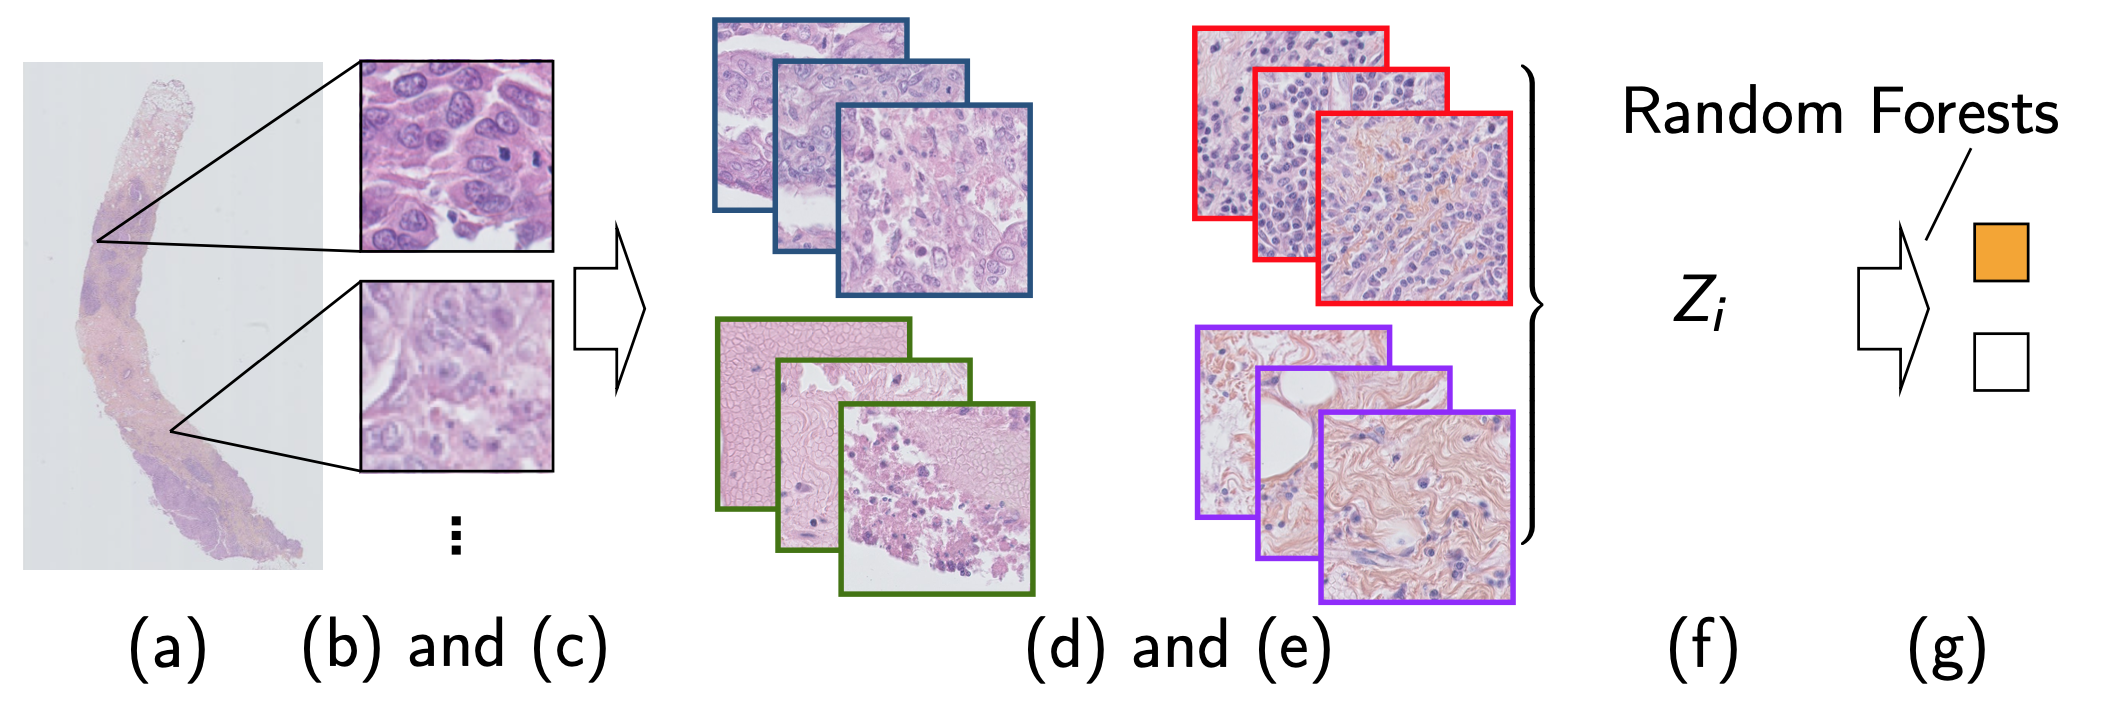 Figure 7: Two step method idea
- Needle-core biopsy section
- Tiling the available tissue
- Bag of tiles
- Clustering model training
- Tile cluster assignment
- Needle-core biopsy section encoding
- Needle-core biopsy classification
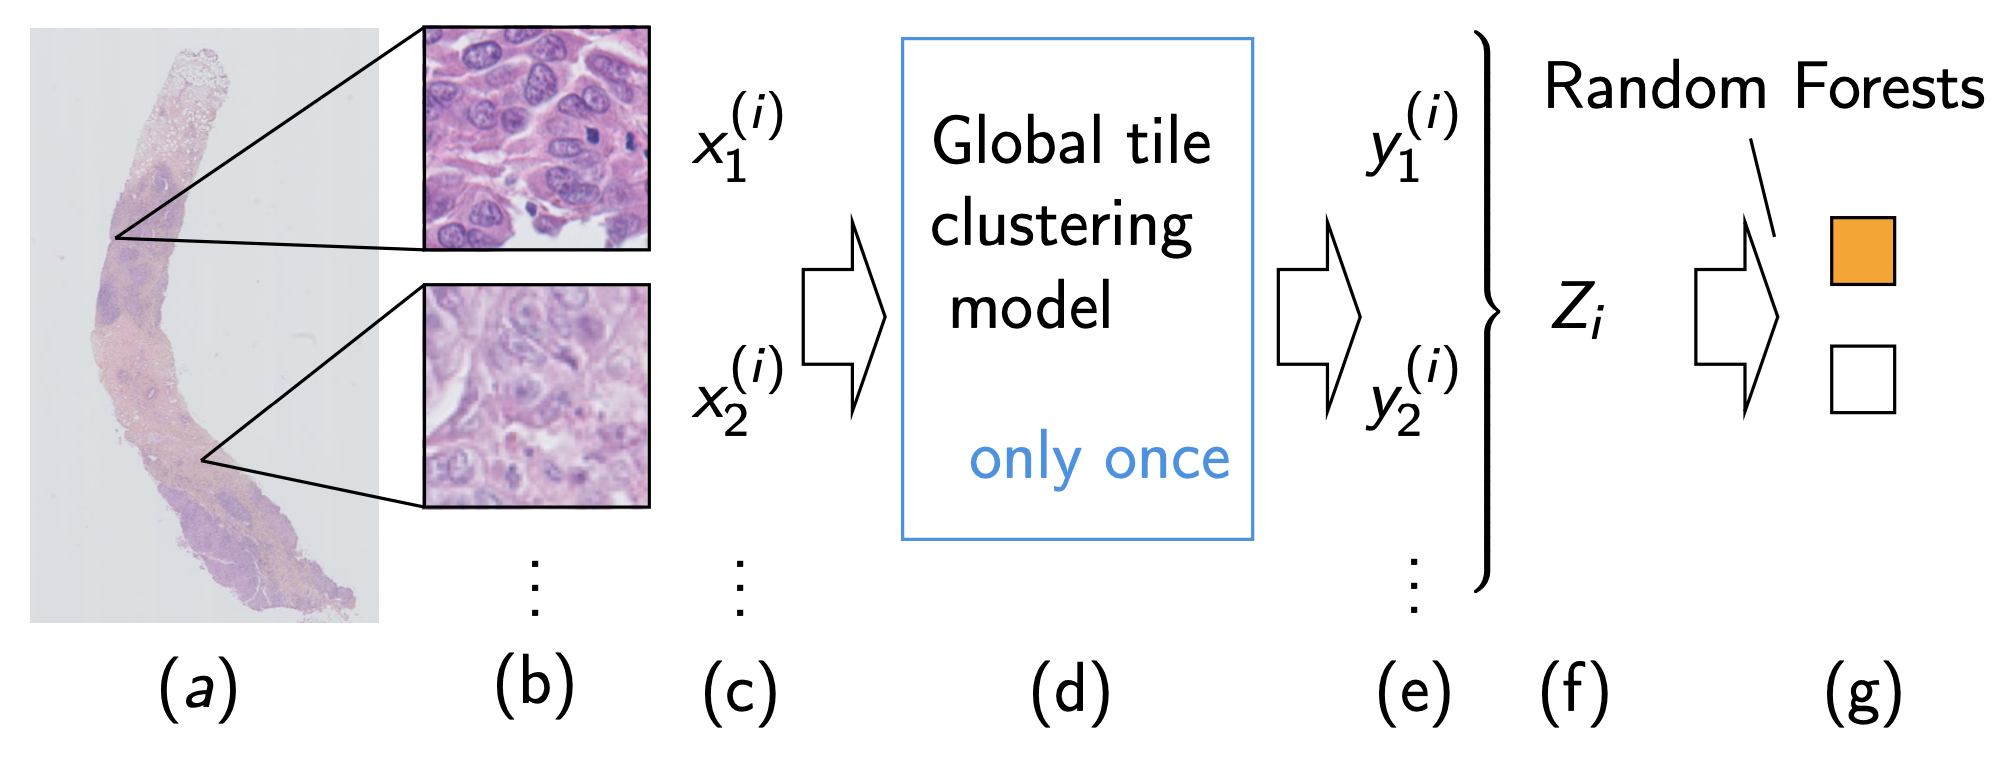 Figure 8: Two step method in practice
- Needle-core biopsy section
- Tiling the available tissue
- Bag of tiles
- Clustering model training
- Tile cluster assignment
- Needle-core biopsy section encoding
- Needle-core biopsy classification
One step model
 Figure 8: One step method
- Needle-core biopsy section
- Tiling the available tissue
- Bag of tiles
- Bottleneck neural network layer, reducing each tile encoding to a smaller encoding
- Continuous tile cluster assignment
- Mean pooling followed by two classification layers for needle-core biopsy section classification.
Parts d., e. and f. were separated in the two step model, they are now unified via a neural network.
Bag averaging
We simply encode the needle-core biopsy section by the average tile encoding and then fit a random forest on top.
Conclusion
The best model is the unified approach with the mean encoding.
